431 urban nodes. One deadline.
Under the revised TEN-T Regulation, 431 European urban nodes must adopt a Sustainable Urban Mobility Plan by the end of 2027. By the same date, Member States must begin submitting urban mobility data for each node, covering sustainability, safety and accessibility.
The EU's SUMP guidelines, updated in 2026, expect a plan to rest on an assessment of how every mode performs today, a baseline that progress can be measured against, and monitoring once measures are in place. They also note that data gathering is among the costliest parts of preparing a plan.
For walking and cycling, that means knowing the condition of the network street by street. That is the part StreetVision delivers.
Assess current performance
A status analysis and a baseline for every mode, including walking and cycling.
Plan safe, connected networks
Comprehensive and safe networks for walking, cycling and micromobility are a named action area.
Monitor and report
Indicators and targets tracked after adoption, with corrective action when progress falls short.
Not one of the 431?
Small and medium-sized cities are not legally required to prepare a SUMP, but can follow the same approach voluntarily. The package works the same way for them.
One scope. Three parts.
Each part feeds a specific step of the SUMP cycle, so the outputs slot into the plan your team or lead consultant is already writing. Commission one part or all three.
Establish your baseline
SUMP Step 3 · Analyse mobility situation
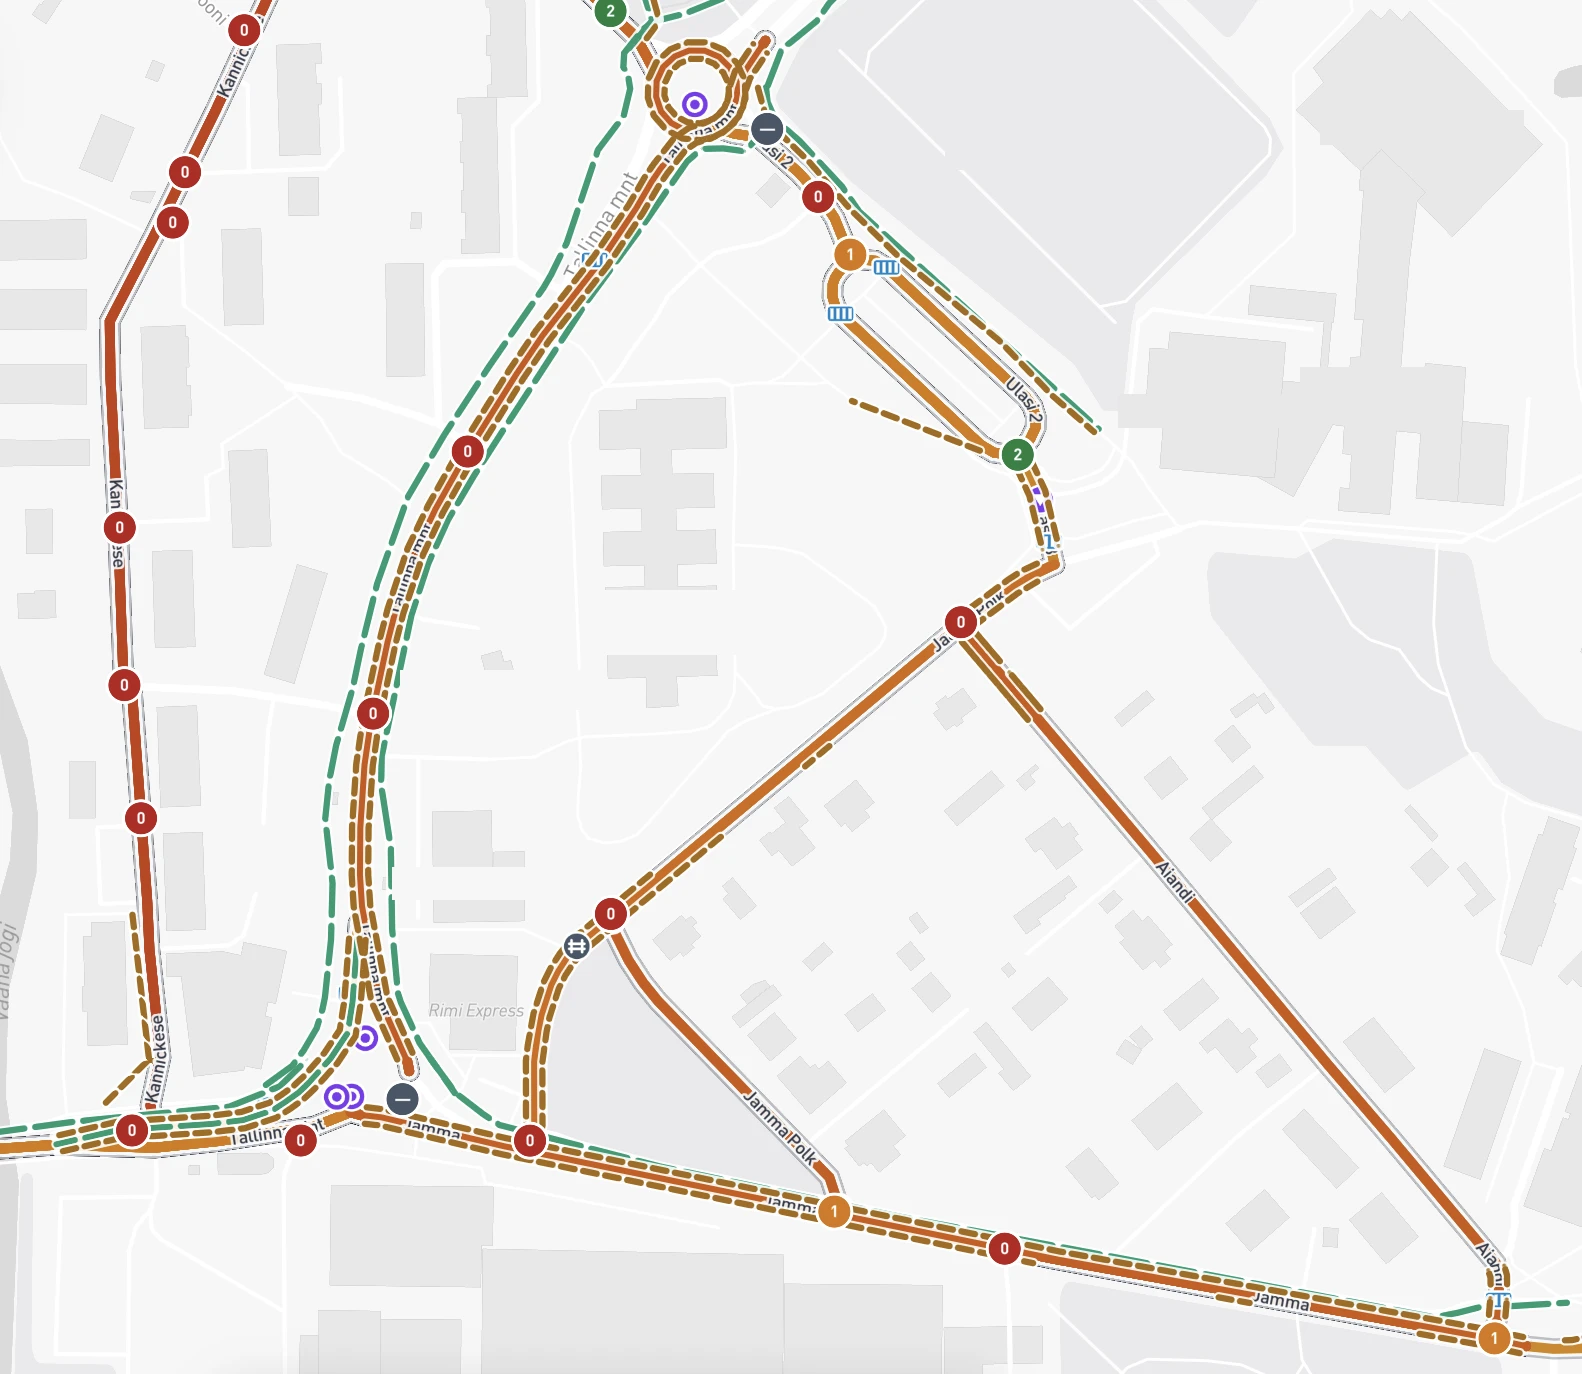
A mapped assessment of walking, wheeling and cycling infrastructure across an agreed area, scored against your local standards.
- Assessment map of quality, safety, comfort and access
- Network gaps, missing links and barriers identified
- A documented baseline for later comparison
- Exportable outputs for your analysis chapter
Prioritise improvements
SUMP Steps 7–8 · Select measures, agree actions
Weak links, route options and candidate interventions compared in one view, with the evidence to explain each choice.
- Weak links and priority areas identified
- Route options compared on safety, comfort and demand
- Estimated costs and utility for each option
- Evidence for your measure long list
Monitor what changes
SUMP Steps 11–12 · Monitor, review and learn
The same assessment repeated on an agreed cycle, so progress is measured against the original baseline with the same method.
- Repeat assessments on a cycle you choose
- Change shown against the original baseline
- Evidence for progress reports and plan reviews
Counts where you need them
We can also arrange traffic, cyclist and pedestrian counts alongside the assessment, for the baseline or for monitoring.
What this covers
A SUMP spans every mode of transport, along with participation, financing and political adoption. StreetVision supplies the walking, wheeling and cycling evidence within it and works alongside your planning team or lead consultant. It does not replace the plan-making process.
Start with one area. Then scale city-wide.
You do not have to commit to the whole network up front. Pilot StreetVision on a neighbourhood or a few priority corridors, review the evidence with your team, then extend the same assessment across the city.
Choose a pilot area
A neighbourhood or a few priority corridors. We agree the scope and the local standards to score against.
We assess it
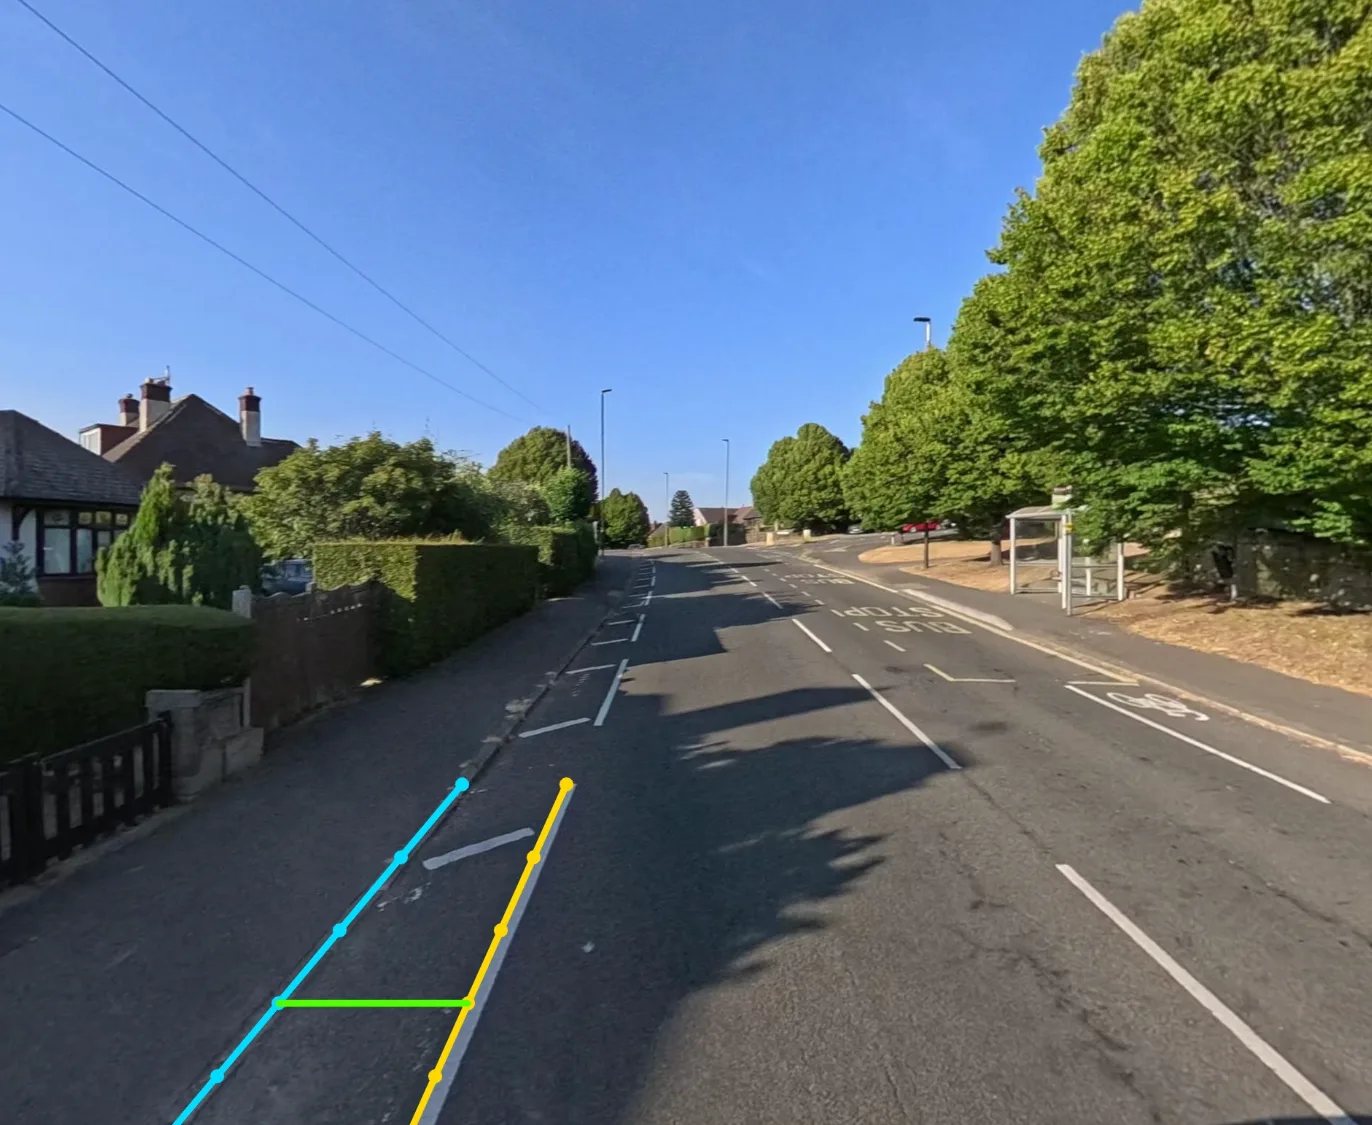
Street-level imagery, computer-vision sweeps and geospatial data are combined into scored route segments, reviewed by engineers.
Review it with your team
You receive the assessment map and exportable outputs, with the evidence behind every score. Check them against streets you know well.
Extend the same assessment across the whole network.
Once you are confident in the results, we apply the same method across the city or functional urban area to build the full baseline for your SUMP. Scaling up is quick: as an example, we can assess 250 km of network in a week, at a fraction of the cost of a manual audit.
For cities and the partners planning with them.
StreetVision has delivered full network assessments for European cities and districts, including city network pilots across Estonia and Lithuania, with scoring rubrics and data sources adapted to local standards.
City and metropolitan authorities
Get the walking and cycling evidence for a new or updated SUMP without building a survey programme from scratch.
SUMP consultancies and planning partners
Add a network-wide infrastructure assessment to your analysis and measure planning, delivered as a defined workstream.
Teams with a plan already adopted
Use repeat assessments to monitor delivery, report progress and prepare the next review.
“StreetVision’s assessment map covers 53 individual metrics, showing not only where our network falls short, but also where it performs well and why.
“Done traditionally, the manual surveys and geodetic data collection would have taken us weeks, if not months.”

Tell us the area. We will come back with a scope.
Share the city, the area you have in mind and where your SUMP stands. We will respond with a practical scope for the baseline, options and monitoring.